Flow Mode
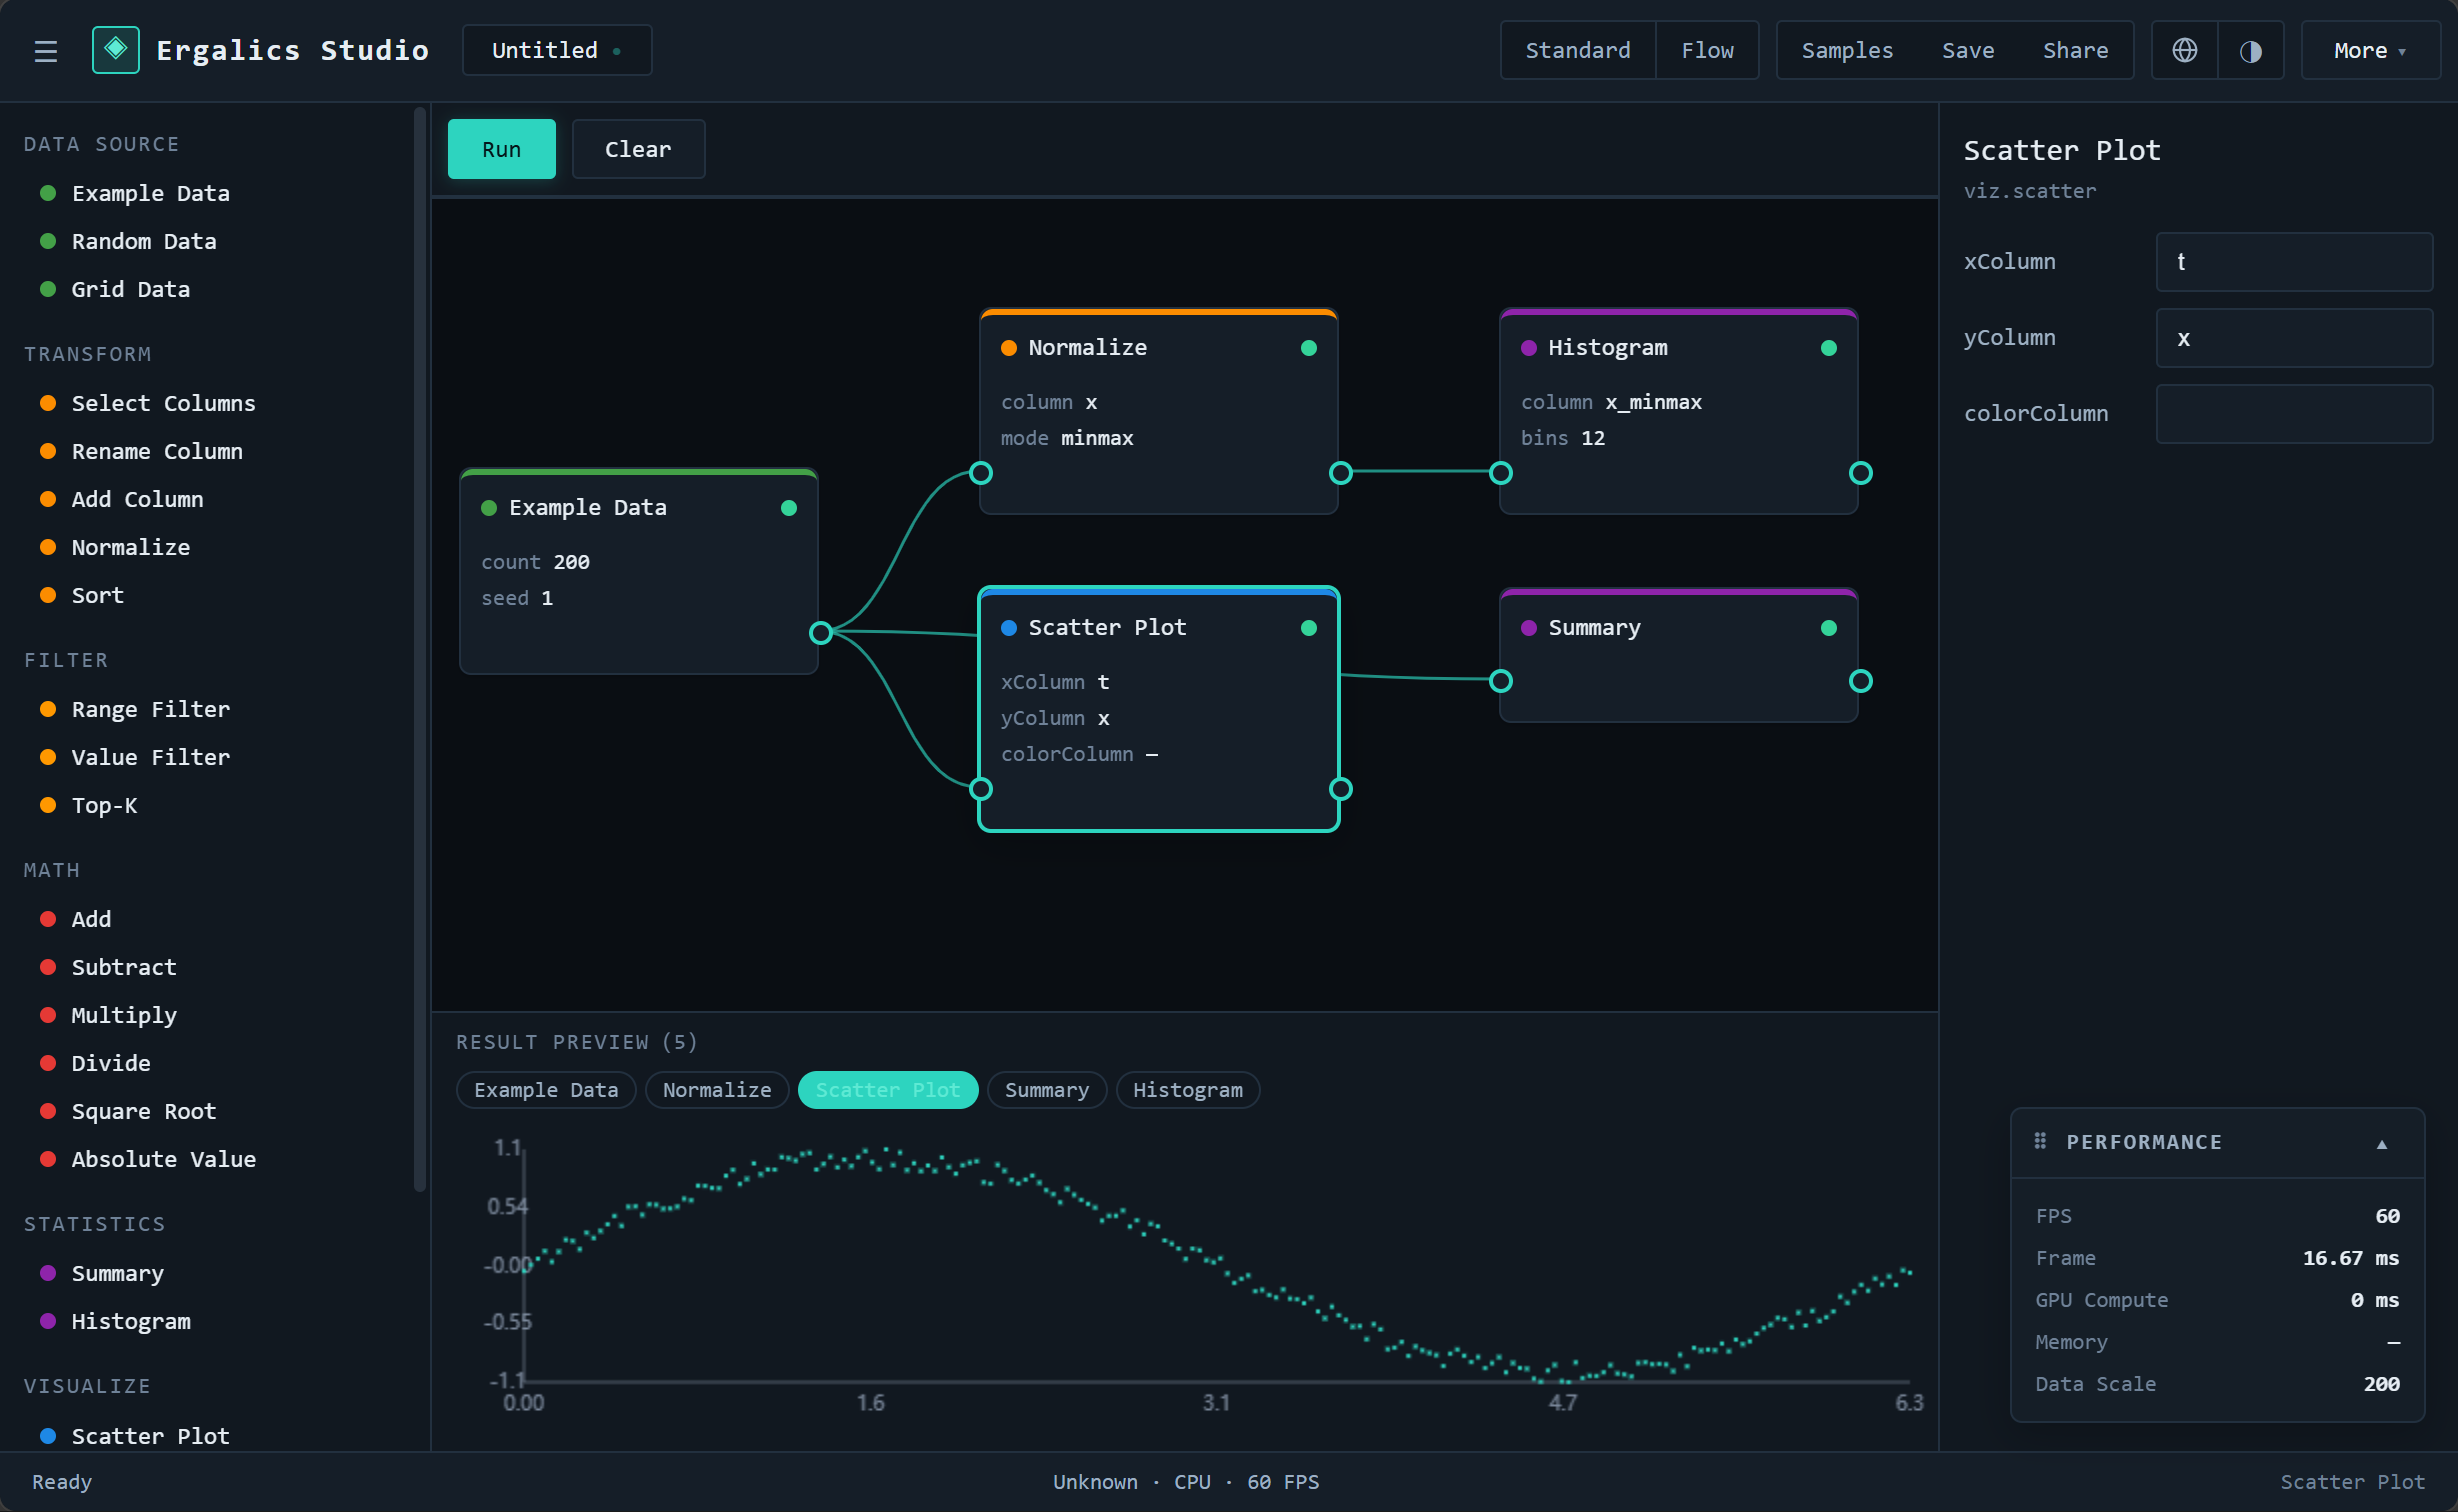
Flow mode is the workbench's second mode (the first is Standard — drag data onto a plugin). In Flow mode you compose a visual dataflow pipeline: drop blocks on a canvas, wire their ports together, and the runtime executes the graph topologically. The result of every node is inspectable in the same place, in the same shape it would have if you had wired that block by hand.
The two modes
| Mode | Mental model | When to use |
|---|---|---|
Standard | Load a file → see a viz | You have a dataset and want to look at it. |
Flow | Compose a DAG → run it → see every node's output | You want to transform data step by step, mixing sources, math, stats, and viz. |
Switch with the Standard | Flow cluster in the top bar.
Architecture
The block system lives in src/blocks/ and is layered so that the heaviest piece — the compiler — stays a pure function over metadata:
types/      DataTable · Scalar · RenderedView · BlockMeta · BlockGraph
blocks/
  registry       meta + executor registration, category buckets
  compiler       pure: validate → topological sort → CompiledRegion
  executor       DagExecutor: run(), incremental cache, dirty propagation
  context        MemoryStorage + RuntimeEnvironment
  ops            pure column kernels (subset, normalize, histogram, …)
  catalog        40+ built-in block types (data_source → … → plot · visualize)
  l10n           blockName / blockDescription (locale resolution)
  sample         SAMPLE_PIPELINES from examples/projects/*.clproj
  render         the only side-effectful step: viz.* → plugin.loadData
stores/
  blockStore     Zustand: graph state + run() orchestration + nodeOutputs
components/blocks/
  BlockCanvas · BlockNode · BlockPalette · BlockToolbar
  ParamEditor · BlockPreview · BlockWorkbench
  geometry.ts    pure hit-testing / port math (vitest-covered)
The compiler never touches React. The executor is async but side-effect-free. Only render.ts (and the VizPayload → plugin.loadData bridge it owns) crosses into the plugin world — by design, so the executor stays trivially testable.
The graph model
A pipeline is an instance of BlockGraph:
instances: BlockInstance[]— nodes (id,blockId,position,params, optionalregions).connections: BlockConnection[]— edges (from {nodeId,portId}→to {nodeId,portId}). The connection list is the single source of truth for edges; an instance never carries its inputs.viewport: {x, y, zoom}— the canvas pan/zoom state.
BlockInstance.regions is reserved for future control-flow nesting (if/else, repeat, parallel) — currently unused but the seam is in place so adding those later is an extension, not a refactor.
Values that flow on ports
Three types, defined in src/types/datatable.ts:
| Type | Shape | Producers | UI rendering |
|---|---|---|---|
DataTable | { columns, length, getColumn, getRow, columnNames, … } | source.*, transform.*, stats.* | Read-only table (or a viz via viz.*) |
Scalar | { kind: 'scalar', value: number | string | boolean } | (future reductions / control flow) | Inline value |
RenderedView | { kind: 'rendered-view', id, viewType, data } | viz.* blocks | Live plugin render (the host's 2D canvas) |
A pipeline mixes them freely — the result preview adapts.
Compiler: pure validation + topology
compile(graph, registry) is a pure function with no React, no async, no IO. It returns a CompileResult with either a program: CompiledRegion or a list of structured diagnostics:
- Port-level checks — every input is connected (when required), types match (a
DataTableport cannot be wired to aRenderedViewsource), and the registry knows everyblockId. - Cycle detection via Kahn's algorithm. The same pass produces the topological order, so a cycle is reported as a diagnostic and the program is rejected.
diagnostics: CompileDiagnostic[]withseverity: 'error' | 'warning'plus optionalnodeId— the canvas paints red edges and an inline strip in the toolbar surfaces them, instead of crashing.
Executor: incremental, cache-friendly
DagExecutor(program, env).run() walks the topological order. After the first run it holds a Map<nodeId, DataValue> cache; invalidate(nodeId) walks downstream and marks everything that depends on nodeId dirty. Changing a single parameter therefore re-executes only that node and its descendants, which is what makes the canvas feel instant even for non-trivial pipelines.
The executor is the only async piece in the block system; every executor returns a Promise<DataValue> so GPU work can slot in later without an API change.
The render bridge — viz.* never draws
A viz.* block emits a RenderedView — pure data:
{ kind: 'rendered-view', viewType: 'scatter', data: { pluginId, text } }Rendering happens in src/blocks/render.ts, which constructs a File from the serialized text and hands it to the target plugin's loadData. This keeps two properties intact:
- The block system has zero DOM/plugin coupling — easy to test, easy to reuse in headless environments.
- Adding a new visualization is "write a block that produces a
RenderedView" — the renderer does the rest.
Result preview
The result preview panel sits below the canvas and has three modes, picked automatically from the selected (or last) node's output:
RenderedView→ the host's 2D canvas renders it through the existing plugin (scatter, histogram, …).DataTable→ a read-only table with a sticky header and a "showing first N of M" footer, sostats.summaryandstats.histogrambin counts become visible too — not only theviz.*ones.Scalar→ the value, inline.
When a pipeline has more than one output, a chip strip at the top of the preview switches between nodes; selecting a node on the canvas mirrors the selection.
Built-in blocks
| Category | Blocks |
|---|---|
| data_source | Example Data · Random Data · Grid Data |
| transform | Select Columns · Rename Column · Add Column · Normalize · Sort |
| filter | Range Filter · Value Filter · Top-K |
| math | Add · Subtract · Multiply · Divide · Square Root · Absolute Value |
| statistics | Summary · Histogram |
| visualize | Scatter Plot · Line Chart · Histogram · 2D Point Cloud |
Control-flow blocks (if_else, switch, repeat, parallel) are deliberately deferred. The region seam on BlockInstance is in place so they slot in later as extensions, not refactors; see block-system-design.md §A.1 for the full rationale.
Sample pipelines
examples/projects/ ships pre-built pipelines (real .clproj files — importable through the normal project picker):
| File | What it shows |
|---|---|
block-01-signal-analysis.clproj | Sine + noise → normalize → histogram, plus scatter & summary |
block-02-random-distribution.clproj | 500 uniform randoms → histogram + summary |
block-03-grid-scatter.clproj | 20×20 grid → scatter |
block-04-range-filter.clproj | Sine → range filter → scatter |
block-05-dual-pipeline.clproj | Sine forked into normalize→scatter and range-filter→line |
block-06-topk-pipeline.clproj | Dataset → Top-K selection → table / plot |
block-07-binning-stats.clproj | Numeric column → histogram binning + summary stats |
block-08-normalize-grid.clproj | Grid data → normalize → scatter / line |
Discovery uses import.meta.glob('../../examples/projects/block-*.clproj', { query: '?raw', import: 'default', eager: true }). The samples tab of the Samples dialog enumerates them; display names/descriptions live in src/blocks/sample.ts → SAMPLE_META (en + zh) — data files contain the graph; presentation strings live in code so they can be localized.
Extending: writing a custom block
A block is a BlockDefinition (metadata + executor), registered into the default blockRegistry at startup. The metadata covers i18n:
import { defineBlock } from '@/blocks/catalog/types';

export const myBlock = defineBlock(
  {
    id: 'transform.my_block',
    category: 'transform',
    name: 'My Block',                         // zh-CN default
    nameI18n: { 'en-US': 'My Block' },        // English (and any other locale)
    description: '做一点转换',
    descriptionI18n: { 'en-US': 'Apply a transform' },
    color: '#FB8C00',
    ...dataTableInOut(),
    defaultParams: { column: '', threshold: 0 },
  },
  async (ctx) => {
    const input = ctx.getInput('data') as DataTable;
    const col   = String(ctx.getParam('column') ?? '');
    const thr   = Number(ctx.getParam('threshold') ?? 0);
    // … return a DataTable
  },
);
registry.register(meta, executor) is idempotent — re-registering (StrictMode double-effect or an HMR reload) keeps the first meta and back-fills the executor if one was missing. No "already registered" surprises.
Persistence
The whole graph — instances, connections, viewport — is serialized into ProjectState.blockGraph and round-trips through the same autosave / share / export path that backs every .clproj. Open a Flow-mode project on any machine, get the same canvas.
Localization
UI copy ("运行" / "Run", "流程管线" / "Flow pipelines", diagnostic strips, …) lives in the flat t(key) dictionary under src/i18n/. Block-level names and descriptions live as nameI18n / descriptionI18n on the metadata and are resolved by blockName(meta, locale) / blockDescription(meta, locale) from src/blocks/l10n.ts. The default project name is the constant DEFAULT_PROJECT_NAME = 'Untitled' — fixed English on purpose, so language switching never strands old projects with a stale localized title.
Known limitations
- No control-flow blocks yet — see "Built-in blocks" above. The seam exists; the work is tracked but not scheduled.
- GPU execution in blocks: every executor returns a
Promise<DataValue>but current built-in blocks run on CPU. The contract is ready forgpu.*/ WGSL-backed executors; routing them through the existing Rust core is the next chunk of work. - Layout: blocks are placed by hand. Auto-layout (the obvious next feature) is intentionally not implemented — keep the API stable first.
Looking for a more imperative feel? Block mode is a sibling workbench mode that shares the
DataValuecontract and the plugin bridge — see Block Mode for the architecture, the 40+ built-in blocks, and the 5 sample programs.